Project overview
KrishiSignal collects daily mandi price records and presents them through a data pipeline and Streamlit dashboard for agricultural price intelligence.
PROJECT CASE STUDY /04
An agricultural intelligence project connecting mandi-price data with a streaming analytics dashboard.
KrishiSignal collects daily mandi price records and presents them through a data pipeline and Streamlit dashboard for agricultural price intelligence.
I built the pipeline with Python, Kafka, PySpark and HDFS, with a Streamlit dashboard. It requests the latest available daily records from the data.gov.in API; the source data is updated daily, rather than as a continuous live feed.
Request the latest available daily mandi records from the Data.gov.in resource.
Process records through the documented Python, Kafka and PySpark flow.
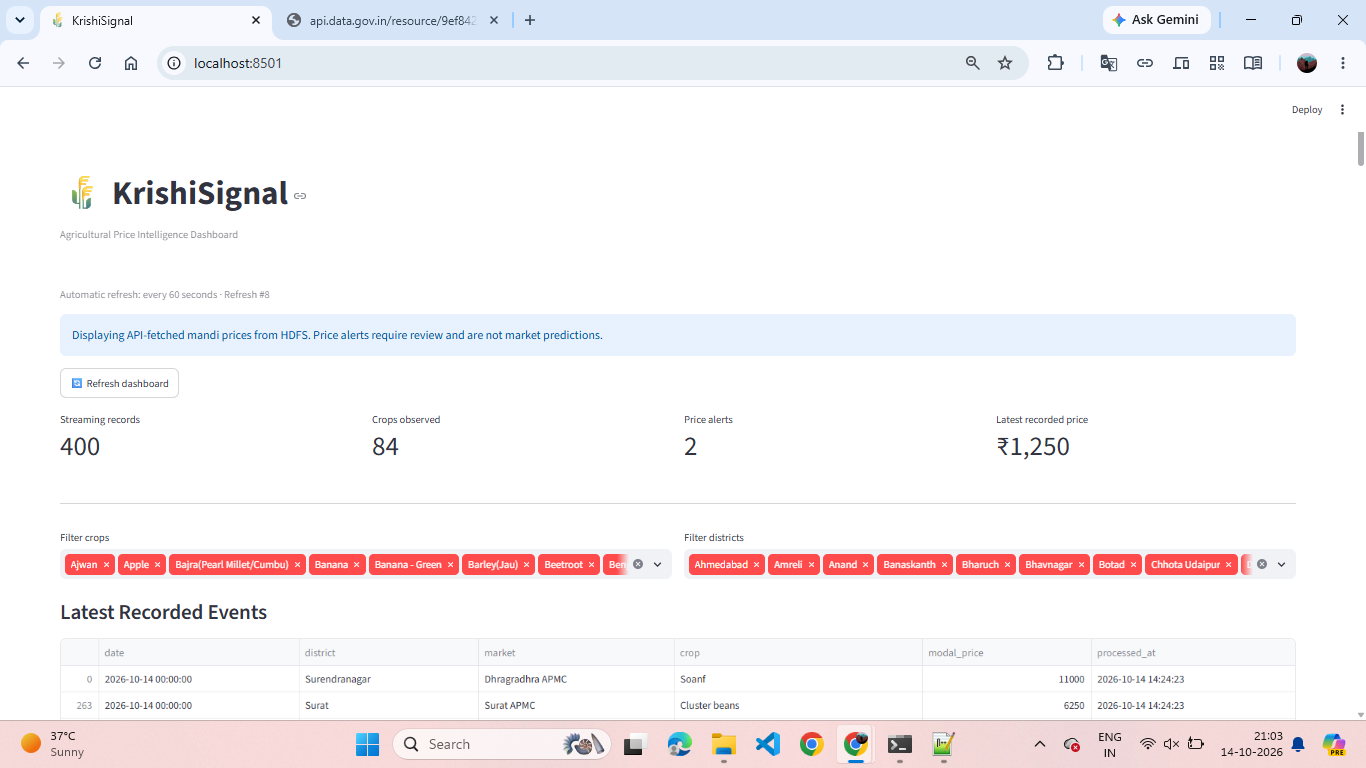
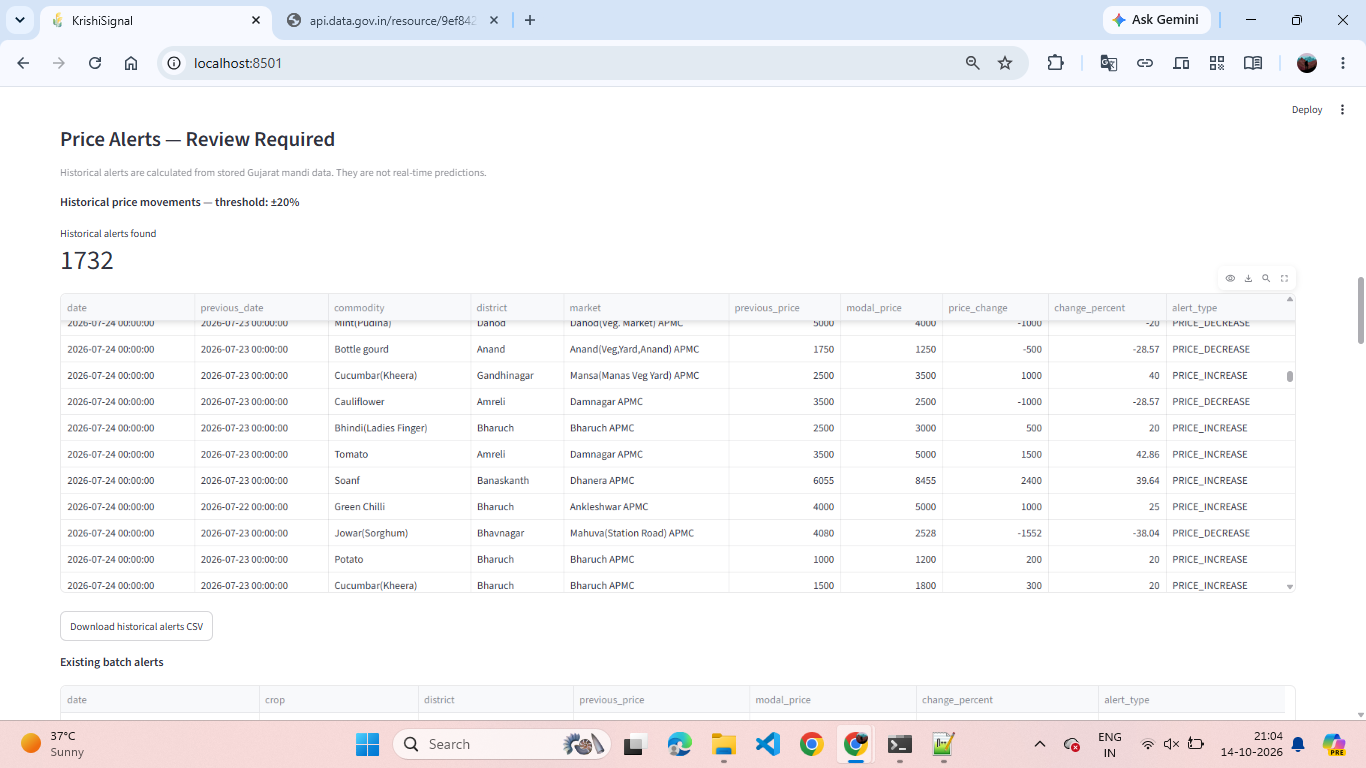
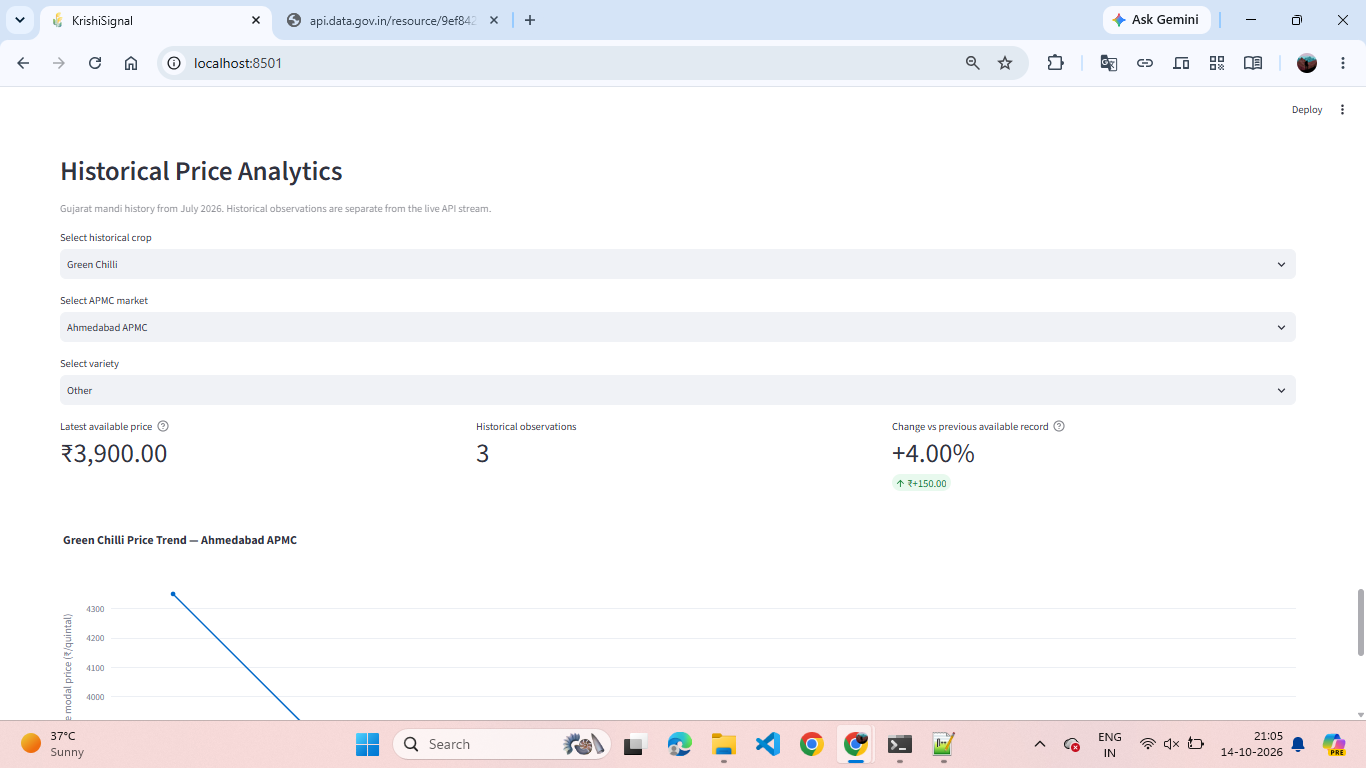
Present project data in a Streamlit dashboard.
Uses the current daily prices resource from data.gov.in.
Python producer, Kafka, PySpark/Spark Structured Streaming and HDFS.
Streamlit interface for the project’s market data and analysis.
Pipeline technologies and operation are described by the developer. Data source records are published daily.
Latest available daily mandi records
Producer
Message stream
Stream processing
Data storage
Dashboard
Request the latest available daily records from the API.
Pass records through the Python producer and Kafka.
Process records with PySpark and store project output in HDFS.
Explore the resulting data through Streamlit.
Captions identify loading states and dated captures where relevant.
 Open full image
 Open full image
 Open full image